Insights
Owners, managers, and analysts who want to explore sales patterns visually before opening a detailed report.
Before you start
- Confirm the correct workspace and brand are selected.
- Decide whether you want all shops or one shop.
- Choose the period you want to review before comparing charts.
Open this page
Open Insights from the Analytics area.
What this page is for
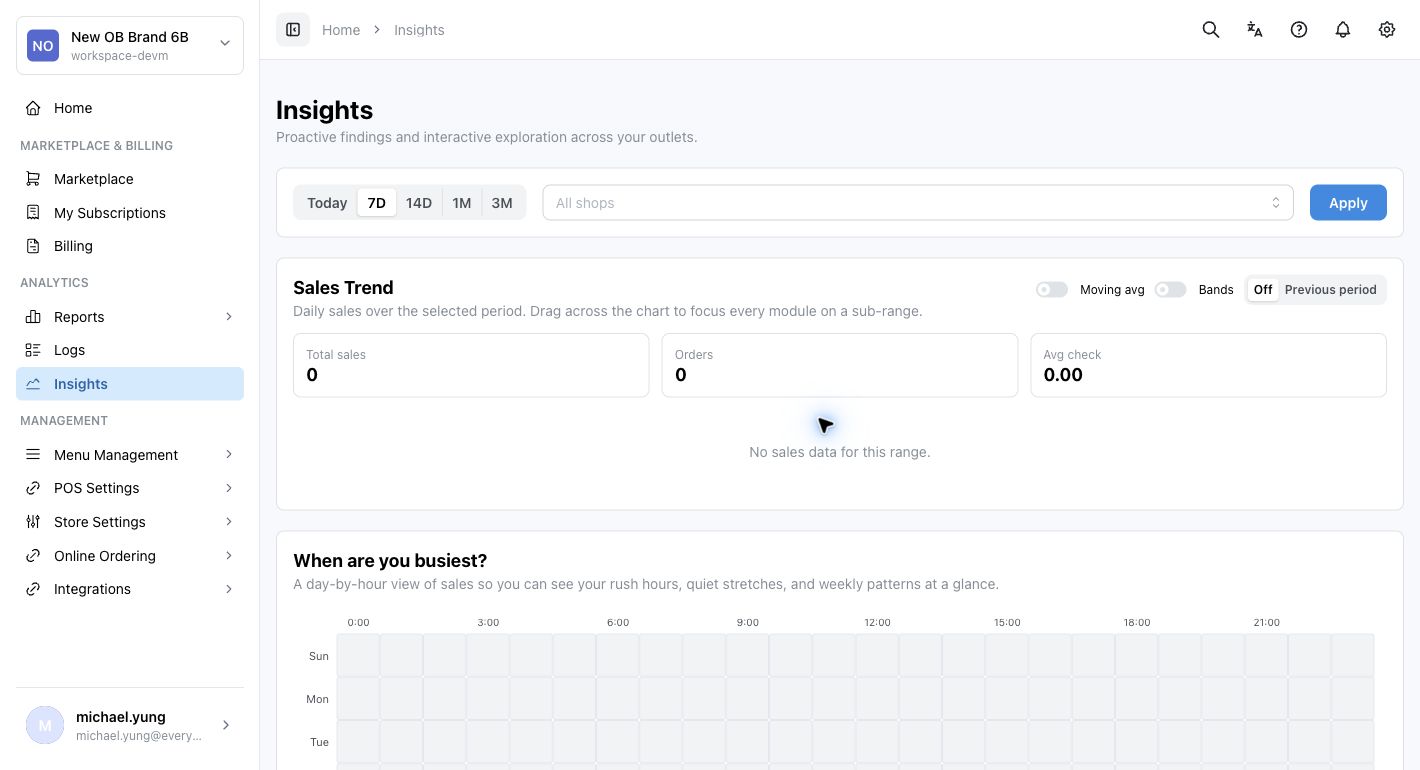
Insights shows proactive findings and interactive exploration across your outlets. Use it when you want to understand patterns, not only read a fixed table.
Main sections
Filters
Use Today, 7D, 14D, 1M, or 3M to choose the reporting period. Select a shop from All shops when you need a narrower view, then select Apply.
Sales Trend
Use Sales Trend to review daily sales, orders, and average check. You can turn on Moving avg, Bands, or Previous period when you need a comparison view. Drag across the chart to focus the other modules on a smaller range.
When are you busiest?
Use this heatmap to find rush hours, quiet periods, and weekly patterns.
Menu and transaction modules
The lower modules help you review menu performance, revenue mix, item movement, basket affinity, check-size distribution, and transaction-level outliers when data is available.
Steps
- Open
Insights. - Select the period, such as
7Dor1M. - Select
All shopsor a single shop. - Select
Apply. - Review
Sales Trendfirst. - Use
When are you busiest?to identify timing patterns. - Use the menu and transaction modules to find items or checks that need follow-up.
- Open Sales Reports when you need a table or export for the same question.
What changes after you save
There is no save action on this page. Filters only change the current view.
How to check your result
- Confirm the selected period and shop filter.
- Confirm whether
Previous period,Moving avg, orBandsis turned on. - If a number needs formal review, open the matching Sales Report for the same scope and date range.
If something goes wrong
- If the page shows no data, confirm the selected period has completed transactions.
- If the chart looks too broad, select one shop or a shorter period.
- If a module does not explain the issue clearly, use Sales Reports for row-level detail.
When to ask owner/admin
- The insight affects pricing, menu design, staffing, or loss-prevention decisions.
- You cannot reconcile the chart with the matching report table.