Sales Reports
Owners, finance staff, and managers who need revenue, tender, and item-performance reporting.
Before you start
- Confirm the correct brand and shop scope.
- Confirm the date range before you compare results.
- Decide whether you need a summary, a breakdown, or a transaction-level report.
Open this page
Open Reports -> Sales Reports.
What this page is for
Sales Reports is the main financial reporting area in HQ.
Use it to answer questions about:
- revenue trends
- sales mix
- payment mix
- discount impact
- transaction history
- customer and member contribution
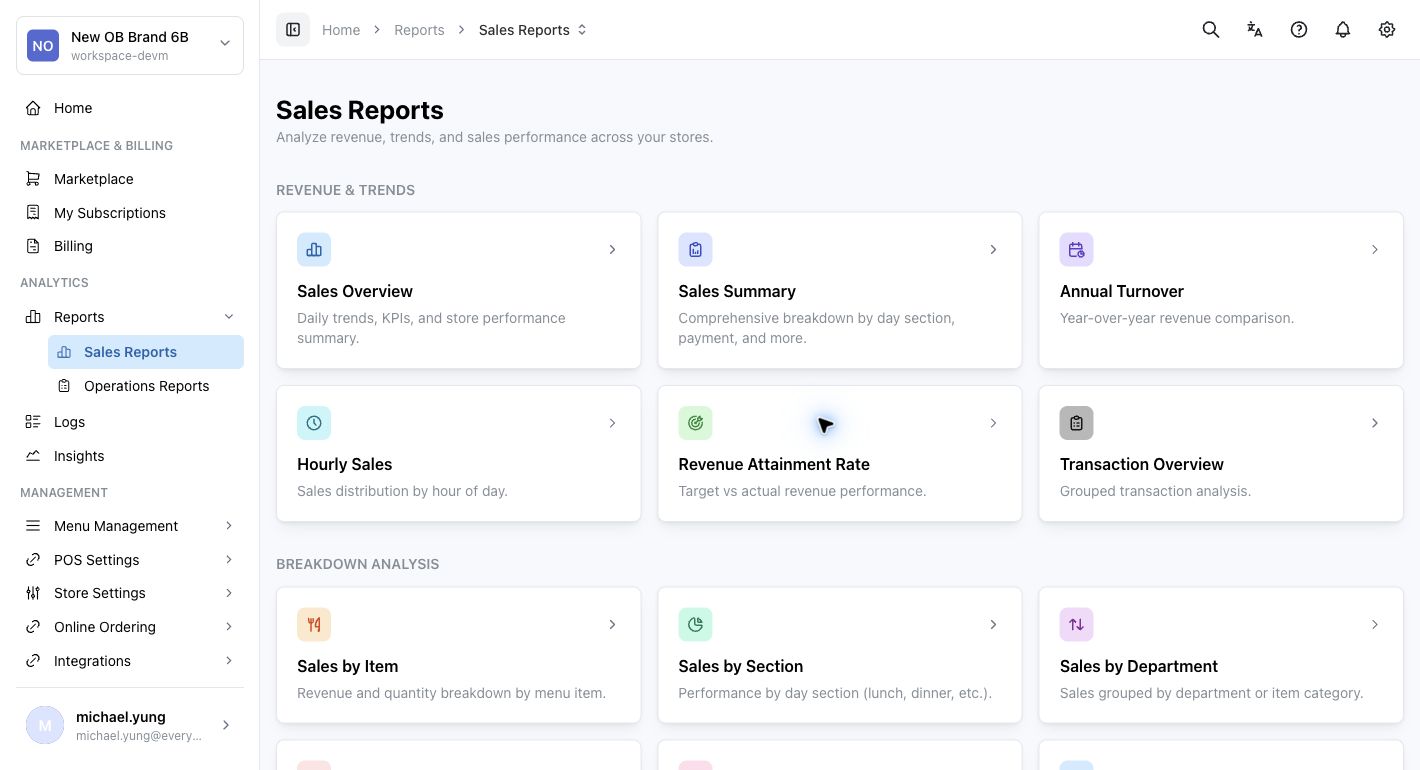
Main report groups
Revenue and trends
Use this group for high-level performance review.
Examples:
Sales OverviewSales SummaryAnnual TurnoverHourly ReportRevenue AttainmentTransaction Overview
Breakdown analysis
Use this group when you need to slice performance by business dimension.
Examples:
Sales by ItemSales by SectionSales by DepartmentSales by DiscountSales by ModifierPayment Methods
Detailed records
Use these reports when you need record-level or audit-style detail.
Examples:
Transaction ListOrder DetailsPayment DetailsFood Cost
Customers and partners
Use this area when you need member or customer-linked analysis.
Example:
Members Analysis
Key table actions
Many Sales Reports use a shared table toolbar.
- Select the search icon to filter rows in the current report.
- Select the sort icon to change the report order.
- Select the columns icon to show, hide, reset, or show all table columns.
- Select
Export CSVwhen you need a spreadsheet-friendly copy of the current table. - Use the page controls and
Refreshbefore comparing exported data.
Some detail reports also link to a fuller view. For example, Transaction List can open related Order Details, and payment amounts can open Payment Details.
How to use this page
Start broad, then move into detail:
- Use summary reports to confirm the overall result.
- Use breakdown reports to locate the source of the change.
- Use
Transaction Overview,Transaction List,Order Details, orPayment Detailswhen you need receipt-level confirmation. - Export only after confirming the scope, date range, filters, and visible columns.
What changes after you save
These reports are mainly for viewing, filtering, and exporting. They do not usually change store behavior, but the wrong scope or date range can still lead to the wrong decision.
How to check your result
- Confirm the correct brand and shop scope.
- Confirm the date range.
- If a number looks wrong, compare it with a related report instead of immediately changing filters everywhere.
If something goes wrong
- Check the selected scope first.
- Check the selected date range second.
- If totals still look inconsistent, compare summary and detailed reports for the same period.
When to ask owner/admin
- The output affects accounting, payroll, tax, or compliance decisions.
- You cannot explain the difference between two report results for the same period.